

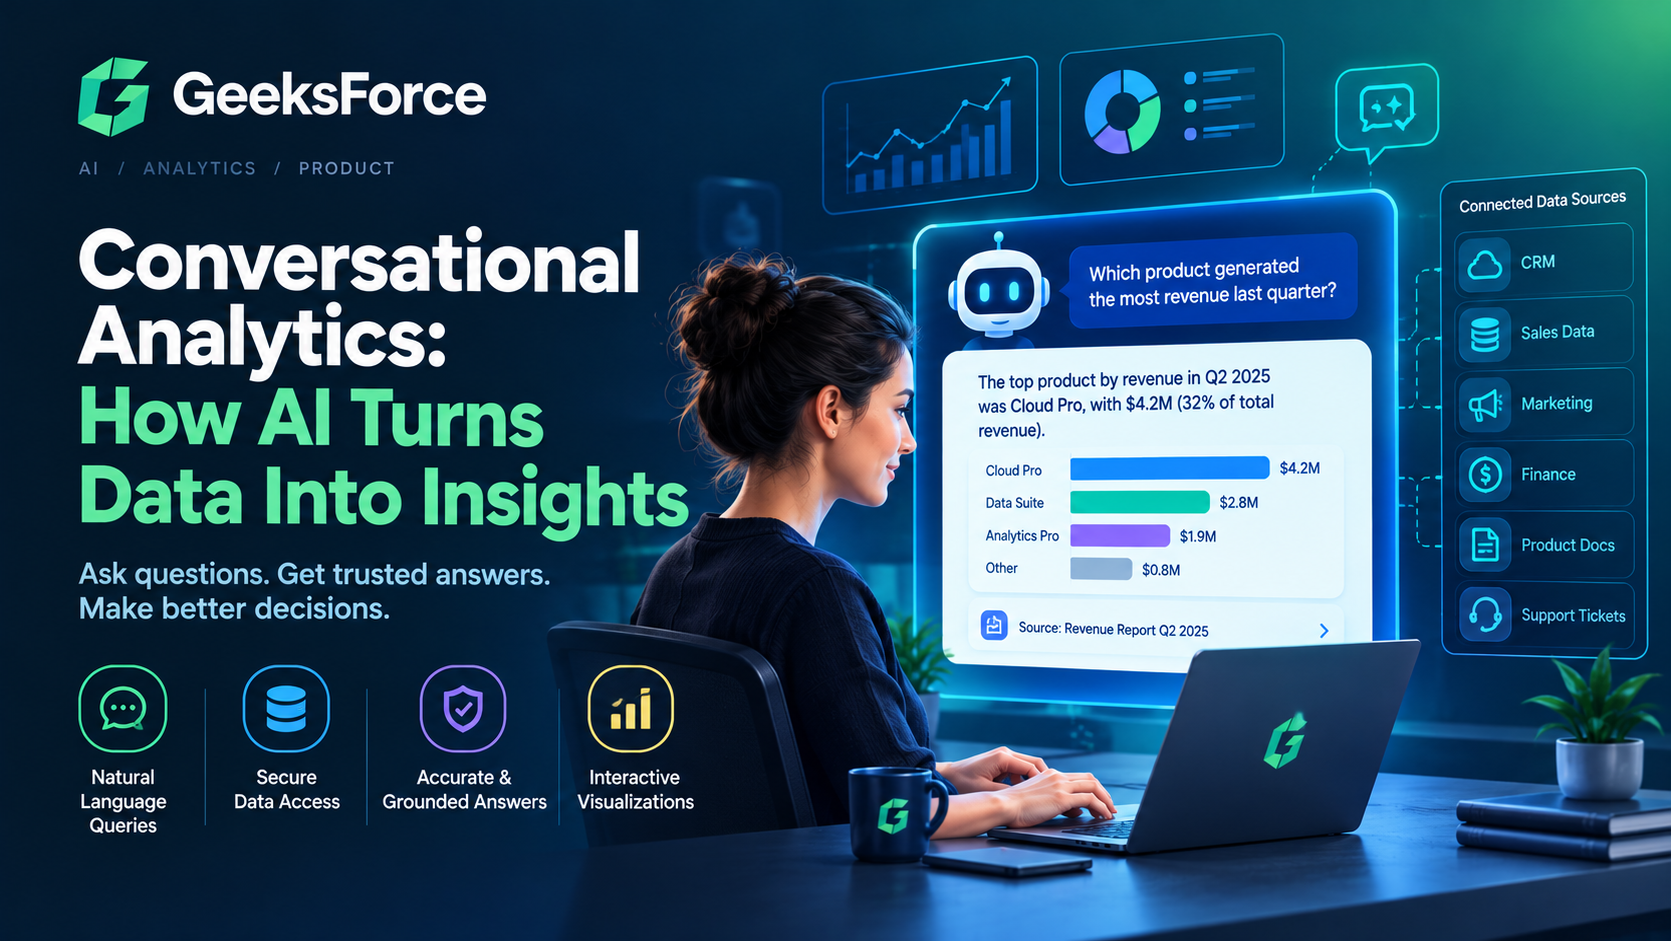
Businesses collect enormous amounts of data from sales platforms, customer relationship management (CRM) systems, financial software, marketing tools, and operational databases. Yet turning that data into useful insights can still require technical expertise, specialized dashboards, and time-consuming requests to data teams.
A sales manager might want to know which products generated the most revenue last month. An operations director might need to identify why delivery times increased. A marketing team might want to compare campaign performance across regions.
Traditionally, answering these questions involves opening dashboards, adjusting filters, exporting spreadsheets, or asking an analyst to write SQL queries.
Conversational analytics changes this process by allowing people to ask questions about business data in natural language and receive data-backed answers.
Instead of navigating multiple reporting tools, employees can ask questions in a conversational interface and explore the results through follow-up questions, tables, and charts.
However, making business data accessible through AI requires more than connecting a chatbot to a database. Organizations must also address data quality, access permissions, business terminology, query accuracy, and governance.
In this guide, we explore how conversational analytics works, where it creates value, and how businesses can implement it reliably.
What Is Conversational Analytics?
Conversational analytics is an approach to data analysis that allows users to explore business information through natural-language conversations rather than relying exclusively on dashboards, spreadsheets, or manually written database queries.
Users can ask questions in everyday language, and an AI-powered system interprets the request, retrieves or analyzes the relevant data, and presents the results in an understandable format.
For example, a business user could ask:
- Which products generated the highest revenue this quarter?
- Why did customer churn increase last month?
- Compare our marketing spend with sales revenue across regions.
- Which customers have not placed an order in the last 60 days?
- Show our monthly revenue trend and explain the biggest changes.
The system translates these questions into appropriate analytical operations and returns results based on the available data.
Conversational analytics is closely related to natural-language querying, AI-powered business intelligence, and text-to-SQL systems. In contact centers, the term can also refer to analyzing customer conversations, such as call transcripts and support chats. This article focuses primarily on conversational analytics for querying and understanding business data.
How Does Conversational Analytics Work?
A conversational analytics platform combines natural-language processing, large language models (LLMs), data connectors, query execution, and visualization components.
A typical workflow includes five stages.
1. The user asks a question
The process begins when someone submits a question through a chat interface embedded in a website, internal business application, or analytics platform.
For example:
“Which region generated the most revenue last quarter?”
The system must identify the user’s intent and determine what the terms mean in the organization’s business context.
2. AI interprets the question
An LLM interprets the request and maps it to relevant data sources, fields, metrics, and filters.
For example, the system might need to understand that:
- “Revenue” means recognized sales revenue rather than total order value.
- “Last quarter” refers to the company’s fiscal calendar.
- “Region” refers to a specific field in the sales database.
- “Generated the most” means ranking regions by the selected revenue metric.
This step is critical. A query can be syntactically correct and still produce a misleading answer if the system misunderstands the business terminology.
3. The system generates and validates a query
Once the request is understood, the system generates an appropriate query, such as SQL, or invokes a predefined analytical operation.
Before execution, the application should validate the query against an approved schema, permitted operations, and the user’s access rights.
For example, it might reject a query that attempts to access an unauthorized table or perform a destructive database operation.
4. The query executes against the data source
The validated query runs against an authorized database, data warehouse, or analytical service.
Depending on the implementation, data may come from PostgreSQL, a cloud data warehouse, CRM software, spreadsheets, or other connected business systems.
The application should preserve the source system’s access controls and return only the information the user is permitted to see.
5. AI explains the results
The platform converts the query results into an understandable response, potentially including:
- A concise natural-language explanation.
- A table with relevant figures.
- A chart showing trends or comparisons.
- The reporting period and metric definitions.
- The query or data source used to produce the result.
Users can then ask follow-up questions without starting over.
For example, after seeing regional revenue, a user might ask, “What about the previous quarter?” or “Which products contributed most to that growth?”
This conversational continuity is one of the main advantages over traditional reporting interfaces.
Conversational Analytics vs. Traditional BI Dashboards
Traditional business intelligence (BI) tools and conversational analytics solve related problems, but they offer different ways to access information.
| Capability | Traditional BI dashboards | Conversational analytics |
|---|---|---|
| User interaction | Filters, charts, and predefined reports | Natural-language questions |
| Exploration | Often limited to configured views | Supports ad hoc questions and follow-ups |
| Technical knowledge | Usually requires dashboard familiarity | Can be accessible to nontechnical users |
| Reporting | Strong for standardized, recurring reports | Useful for exploratory analysis |
| Flexibility | Depends on available dashboard configuration | Can handle new questions within supported data and query capabilities |
| Accuracy | Depends on data quality and metric definitions | Also depends on data quality, metric definitions, and query correctness |
| Governance | Managed through BI permissions and data policies | Requires equivalent controls across the AI and query layers |
Conversational analytics should not automatically replace dashboards. Dashboards remain valuable for monitoring established KPIs, recurring reports, and operational alerts.
A stronger approach is often to combine both: dashboards provide consistent monitoring, while conversational analytics helps users investigate questions that arise from the numbers.
Key Benefits of Conversational Analytics
1. Faster access to business insights
Data teams often receive recurring requests for reports, comparisons, and one-off metrics. A conversational analytics interface can help employees answer supported questions independently.
Instead of waiting for a report to be created, a manager can ask a question and receive a result directly from authorized data sources.
This can reduce reporting friction, although the actual time savings depend on the quality of the data infrastructure and the complexity of the analysis.
2. Data access for nontechnical teams
Not every employee knows SQL or understands how to navigate complex BI tools.
Natural-language interfaces make data exploration more approachable for sales teams, marketing professionals, finance staff, and business leaders.
Users can focus on the business question instead of learning the underlying query language.
3. More flexible analysis
Prebuilt dashboards answer questions anticipated during their design. Conversational analytics supports additional questions that arise during an investigation.
A marketing manager might begin by comparing campaign performance, then ask which channels produced the most qualified leads, followed by a question about conversion rates by region.
This makes data exploration more iterative and interactive.
4. Improved decision-making
When reliable data is easier to access, teams can investigate trends, compare alternatives, and identify potential problems earlier.
For example, a retail company could examine declining sales by product category, compare performance across locations, and investigate inventory levels within the same workflow.
The value comes from helping people reach evidence-based conclusions more efficiently—not from assuming that every AI-generated explanation is correct.
5. Reduced reporting bottlenecks
Analytics engineers and data analysts can spend less time handling repetitive requests and more time building trusted data models, improving data quality, and investigating complex business problems.
Conversational analytics does not eliminate the need for analysts. It can help redirect their effort toward work that requires deeper expertise.
Real-World Use Cases for Conversational Analytics
Sales and revenue analytics
Sales leaders can use conversational analytics to explore revenue, pipeline performance, sales targets, and customer activity.
Example questions include:
- Which sales representatives are closest to their quarterly targets?
- What is our average deal size by industry?
- Which deals have been in the pipeline for more than 30 days?
- How does this month’s revenue compare with the same month last year?
When connected to reliable CRM and financial data, these queries can help sales teams identify trends and prioritize follow-up actions.
Marketing performance analysis
Marketing teams often work with data distributed across advertising platforms, analytics tools, email systems, and CRM software.
A conversational interface can help users investigate campaign performance without manually combining reports for every question.
Example questions:
- Which campaigns generated the most qualified leads?
- How does customer acquisition cost vary by channel?
- Which landing pages have the highest conversion rates?
- Did lead volume increase while conversion quality declined?
For cross-platform analysis, the system needs consistent definitions and reliable data integration. Otherwise, differences between source platforms can lead to misleading comparisons.
Customer support analytics
Support managers can use conversational analytics to understand ticket volume, resolution times, customer satisfaction, and recurring issues.
Example questions:
- Which issue categories have the longest resolution times?
- Did ticket volume increase after the latest product release?
- Which support queues have the largest backlog?
- What are the most common reasons customers contact support?
If the platform analyzes conversation transcripts as well as structured support data, it may also help identify recurring customer concerns. That requires additional controls for personal information, sensitive content, and the reliability of AI-generated classifications.
Financial and operational reporting
Finance and operations teams can investigate expenses, cash flow, inventory, fulfillment, and resource utilization.
For example:
- Which expense categories increased most this quarter?
- Which products are approaching their reorder thresholds?
- Where are delivery delays occurring most frequently?
- How does actual spending compare with the approved budget?
Financial use cases deserve particular attention to auditability, approved calculations, and access controls. Users should be able to trace important figures back to their underlying records and definitions.
Executive reporting
Executives often need concise answers rather than detailed technical reports.
A conversational analytics platform can provide summaries of revenue, customer retention, operational efficiency, and other approved KPIs.
For example, a CEO could ask:
“Summarize the biggest changes in our business performance this month and identify the metrics that need attention.”
The system can summarize relevant indicators, but it should distinguish measured facts from possible explanations. If it cannot establish why a metric changed, it should communicate that limitation rather than invent a cause.
How to Build a Conversational Analytics Platform
Building a production-ready solution requires a well-designed architecture that connects the conversational interface to trusted data and controlled analytical operations.
1. Identify high-value questions
Begin with the decisions employees need to make, rather than starting with a generic chatbot.
Collect common questions from business stakeholders and identify the data required to answer them.
For an initial release, focus on a specific domain such as sales performance, inventory analysis, or customer support reporting.
A narrow scope makes it easier to establish expected answers, validate query behavior, and measure whether the solution provides real value.
2. Prepare and organize the data
Data quality is one of the most important factors in conversational analytics.
Before connecting an LLM to business data, identify the authoritative data sources, document relevant fields, resolve inconsistent definitions, and address data-quality issues.
For example, if two departments define “active customer” differently, the platform needs an explicit business definition or a mechanism to ask which definition the user intends.
Useful preparation steps include:
- Documenting tables, columns, relationships, and business terms.
- Creating curated database views for analytical use cases.
- Defining approved calculations for important KPIs.
- Resolving conflicting records and inconsistent formats.
- Establishing data freshness requirements.
A semantic layer or governed metrics layer can help the system map business language to consistent data definitions.
3. Design the AI and query architecture
A typical architecture includes the following components:
- Frontend: A chat interface built with React or Next.js.
- Backend: An API layer built with FastAPI, Node.js, or another suitable framework.
- LLM: A model that interprets questions and generates structured query plans or SQL.
- Semantic context: Definitions of business metrics, database schemas, relationships, and approved analytical rules.
- Query engine: A controlled service that validates and executes permitted queries.
- Data sources: PostgreSQL, a data warehouse, CRM systems, or other authorized platforms.
- Visualization layer: Components that present answers as text, tables, and charts.
- Observability: Logging, evaluation, latency tracking, and cost monitoring.
The LLM should not receive unrestricted access to production databases. A safer architecture separates query generation from authorization and execution.
4. Implement secure query execution
AI-generated SQL must be treated as untrusted input.
A production system should enforce controls such as:
- Read-only database credentials for analytical workloads.
- Allowlisted schemas, tables, and permitted operations.
- Parameterized queries where applicable.
- Query timeouts and row limits.
- Database-level permissions and row-level security where supported.
- Restrictions on sensitive columns.
- Rate limits and resource budgets.
- Audit logs for user requests and executed queries.
The backend—not the model—must enforce these rules. Prompt instructions alone are not a sufficient security boundary.
5. Add context-aware conversation handling
Users frequently ask incomplete follow-up questions.
For example:
- “Show revenue by region for this quarter.”
- “Now compare it with the previous quarter.”
- “Only include enterprise customers.”
The system needs to preserve relevant context, including the metric, time period, filters, and data source.
However, conversation history should not become an uncontrolled source of query logic. The application should maintain a structured representation of the current analytical context and verify that follow-up requests are compatible with it.
When a question is ambiguous, the system should ask for clarification rather than silently choosing a potentially incorrect interpretation.
6. Return verifiable results
A trustworthy response should explain where the answer came from and how it was calculated.
Depending on the use case, the interface can show:
- The metric definition.
- The reporting period and filters.
- The data source or underlying query.
- The time at which the data was refreshed.
- A table or chart containing the supporting figures.
For high-impact decisions, users should be able to inspect the underlying evidence or reproduce the calculation.
7. Evaluate before expanding
Before rolling out the platform broadly, create a test suite of representative business questions with verified answers.
Evaluate the system across several dimensions:
- Query correctness: Did the generated query express the intended business question?
- Result correctness: Did the query return the expected data?
- Permission enforcement: Was restricted information kept inaccessible?
- Clarification behavior: Did the system recognize ambiguous questions?
- Grounded explanations: Did the response accurately describe the results?
- Operational performance: Were latency and resource consumption acceptable?
Test different wording, follow-up questions, empty results, unusual date ranges, and attempts to bypass restrictions.
Expand to additional datasets only after the initial domain demonstrates reliable performance.
Common Challenges and How to Address Them
Incorrect SQL generation
An LLM may select the wrong table, misunderstand a join, apply an incorrect filter, or calculate a metric improperly.
How to address it: Provide accurate schema metadata, curated views, verified query examples, explicit metric definitions, and automated validation. For critical metrics, prefer predefined analytical functions or approved query templates over unrestricted SQL generation.
Hallucinated explanations
A model may describe a trend incorrectly or claim that one factor caused a change when the data only shows a correlation.
How to address it: Generate explanations from actual query results, distinguish facts from hypotheses, and require supporting evidence for quantitative claims. The system should state when available data cannot establish the answer.
Inconsistent business terminology
Terms such as “revenue,” “churn,” “conversion,” and “active user” may mean different things to different teams.
How to address it: Establish a shared glossary and governed metric definitions. Where multiple definitions are legitimate, make the distinction explicit in the interface.
Data access and privacy risks
A conversational interface can expose sensitive information if it bypasses existing authorization policies.
How to address it: Enforce user identity and permissions at the backend and data-source layers. Apply data minimization, sensitive-field restrictions, audit logging, and appropriate retention policies.
High latency and operating costs
Complex questions may require multiple model calls or expensive database operations.
How to address it: Use bounded query execution, cache suitable results, route simple requests through lighter-weight operations, monitor token and database costs, and set explicit limits for expensive analytical workflows.
Best Practices for Reliable Conversational Analytics
Organizations planning a production deployment should prioritize the following principles.
Start with a defined business problem. A focused use case is easier to test and measure than a system connected to every company database.
Use governed data definitions. Business metrics should have consistent meanings across conversations, reports, and departments.
Keep permissions outside the LLM. Security decisions must be enforced by trusted application and database components.
Validate queries before execution. Treat generated SQL as potentially incorrect or unsafe until it passes the appropriate checks.
Make results transparent. Show relevant calculations, filters, source information, and supporting figures.
Support clarification and abstention. If the system cannot determine what the user means or lacks sufficient evidence, it should ask a question or explain the limitation.
Continuously evaluate performance. Monitor accuracy, permission violations, latency, cost, and user feedback as data and business requirements change.
Keep humans involved in consequential decisions. Conversational analytics can support decision-making, but sensitive financial, legal, compliance, or operational decisions may require additional review.
How to Measure the ROI of Conversational Analytics
The business value of conversational analytics should be measured against a defined baseline rather than assumed from the presence of AI.
Useful metrics include:
| Metric | What it measures |
|---|---|
| Time to insight | How long it takes a user to obtain a usable answer |
| Self-service resolution rate | Percentage of supported questions answered without analyst intervention |
| Query accuracy | Percentage of evaluated queries that produce correct results |
| Result verification rate | How often answers can be traced to valid data and calculations |
| Analyst request volume | Changes in repetitive reporting requests |
| User adoption | How frequently intended users actively use the platform |
| Cost per answered question | Model, infrastructure, and query costs per successful response |
| Security incidents | Unauthorized access attempts, policy violations, or data exposure events |
A successful implementation should improve access to reliable insights without introducing unacceptable security risks or misleading results.
The Future of Conversational Analytics
Conversational analytics is evolving beyond simple question-and-answer interfaces.
Modern systems can combine natural-language querying with governed semantic models, multi-step analysis, automated visualizations, and workflow integrations. Some can also coordinate analytical tasks across multiple data sources.
For example, a user might ask an analytics assistant to investigate declining sales, compare regional performance, identify affected product categories, and prepare a summary for a review meeting.
Such workflows can reduce the effort required to investigate business questions. However, the quality of their conclusions remains dependent on data access, context, analytical correctness, and appropriate controls.
The most useful systems will not simply generate convincing explanations. They will make it easier for people to explore data while preserving a clear connection between every important answer and the evidence behind it.
Build a Conversational Analytics Solution With GeeksForce
Conversational analytics can make business intelligence more accessible, but implementing it reliably requires expertise in AI engineering, backend development, data integration, and application security.
At GeeksForce, we help businesses design and build AI-powered applications that connect existing systems, automate complex workflows, and turn business requirements into production-ready software.
Depending on your requirements, a conversational analytics solution may include:
- Natural-language interfaces for querying business data.
- LLM-powered text-to-SQL and structured analytical workflows.
- Secure integrations with PostgreSQL and cloud data warehouses.
- Governed metric definitions and business context.
- Interactive dashboards, tables, and charts.
- Role-based access controls, monitoring, and evaluation.
Whether you are exploring an initial proof of concept or extending an existing analytics platform, the right implementation starts with a clear business objective and a reliable data foundation.
Ready to make your business data easier to explore? Visit GeeksForce to discuss your AI and software development requirements.
Frequently Asked Questions
What is conversational analytics in simple terms?
Conversational analytics allows people to ask questions about business data in everyday language and receive answers based on that data. Instead of manually building a report or writing SQL, users can explore information through an interactive conversation.
How is conversational analytics different from a chatbot?
A general chatbot primarily generates conversational responses. A conversational analytics platform must also interpret analytical questions, access authorized data, execute appropriate queries, and return results that can be verified against the underlying records.
Does conversational analytics require an LLM?
Not necessarily. Natural-language analytics can use traditional natural-language processing, intent classification, predefined query templates, or other techniques. LLMs make flexible language interpretation and follow-up conversations more practical, but they are only one component of a reliable system.
Can conversational analytics work with SQL databases?
Yes. A platform can translate natural-language questions into SQL for supported databases such as PostgreSQL or connect to a data warehouse through a controlled query service. Schema understanding, permission enforcement, and query validation are essential for production use.
Is conversational analytics accurate?
Its accuracy depends on data quality, metric definitions, query generation, execution controls, and result interpretation. Systems should be evaluated against verified questions and expected results, and should disclose uncertainty rather than invent answers.
Is conversational analytics secure?
It can be designed securely, but security is not automatic. Organizations should enforce user permissions, restrict query operations, protect sensitive fields, monitor activity, and ensure the AI layer cannot bypass database authorization.
Can conversational analytics replace business intelligence dashboards?
Usually, it is more effective as a complement. Dashboards are well suited to recurring KPIs and standardized reporting, while conversational analytics supports flexible exploration and questions that were not anticipated when a dashboard was created.
How long does it take to build a conversational analytics platform?
The timeline depends on the number of data sources, the quality of the existing data model, security requirements, and the scope of the initial release. A focused proof of concept can be much simpler than a production platform supporting multiple departments, complex permissions, and high-stakes reporting.